


Unlock the secrets of successful trading with our comprehensive FREE Trading Course designed for traders of all levels. Learn proven strategies, risk management techniques, and market analysis tools to elevate your trading game. Start today and gain the skills to trade confidently in any market!

As I mentioned at the beginning, I am a Scalper, and consequently, I am satisfied with a small slice of the trend, from 10 to 20 PIPS. Don’t think that with 20 Pips, you can earn less than with 100; trading is based on percentages. Supply and Demand is my favourite strategy for entering the market. As we have already studied, the big boys (banks) are in the market, and we will enter with them through this technique. Why should I go against banks and institutions? Remember that even if you trade with an 8-figure account, you will always be smaller than them. Let’s start with the basic definition: “Supply” represents what the market can offer, while “Demand” represents the quantity of a product or service desired by buyers. In short words:
Supply → Sell
Demand → Buy
Of course, this is a general idea, but we will be able to place our orders through Supply and Demand. There are 5 rules that you must follow:
1) Always look left
2) Sell at the supply zone
3) Buy at the demand zone
4) Use always a stop loss
5) Never forget rules 1-2-3-4
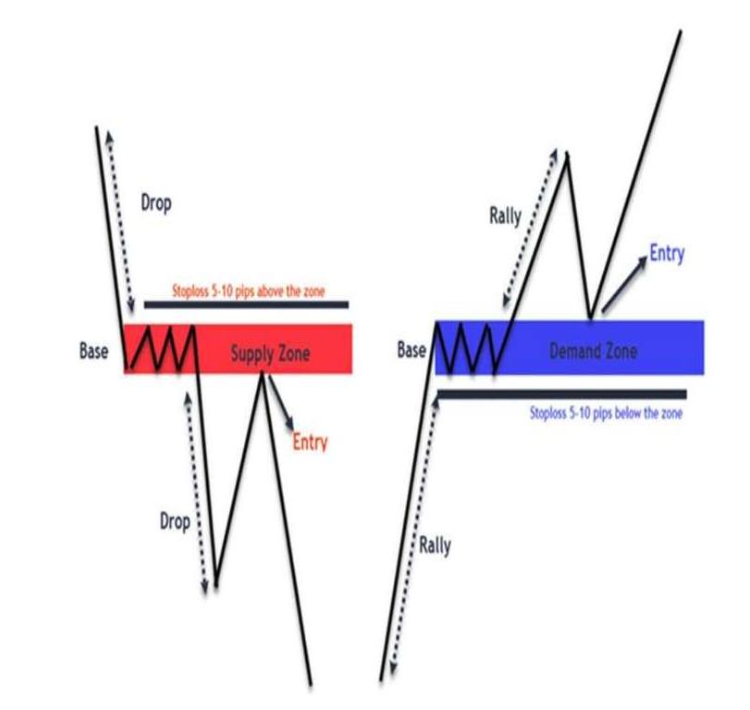
Rally → buyers are more than sellers
Drop → Sellers are more than buyers.
Base → Buyers and sellers are in equilibrium.
In the first case, we see how the sellers are the majority; they have created a base and then continued their descent trend. In the same way, but on the contrary, the figure on the right shows us the same process. The first is called DBD (Drop Base Drop), and the second RBR (Rally Base Rally).
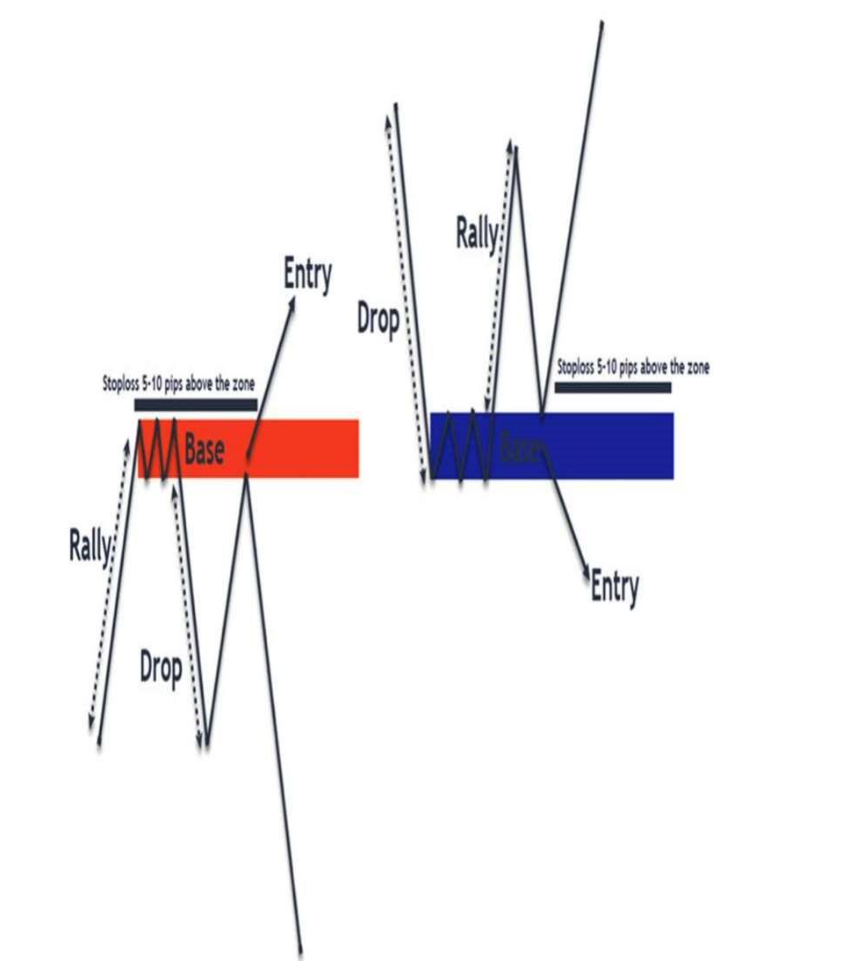
The price will not necessarily continue its rise or fall; in the case shown above, the base stops the continuation of the price and a reversal will occur. The first example is called RBD, while the second DBR. As you can see from the graphs above, you could enter as soon as the price reaches the base, but you don’t have to enter there. Brace yourself and wait for a retest with a confirmation. Don’t rush or the market will do what it wants with you.
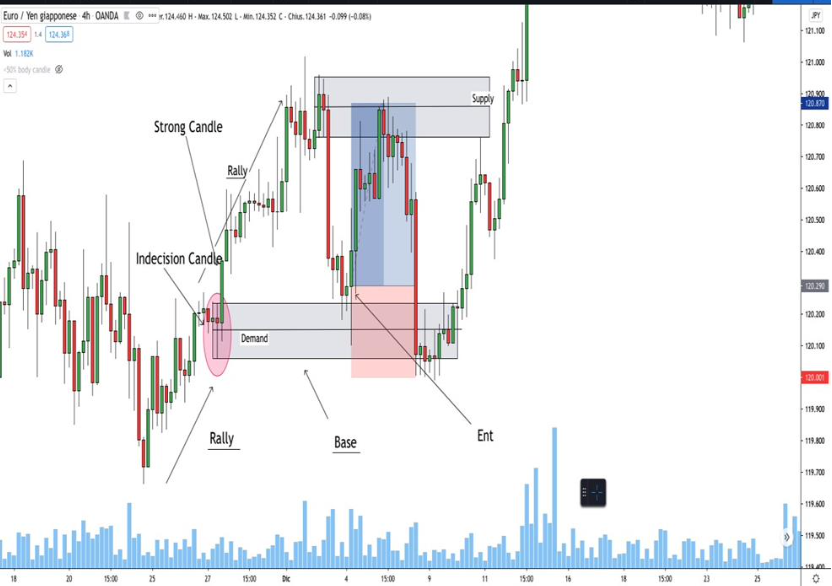
In the figure above, we are in the case of RBR. Let’s start by understanding how to create our zones. The Demand and Supply zone is formed thanks to an indecision candle, and the zone only forms if the indecision candle is followed by a strong candle (the greater the size of the candle, the stronger that area will be). All the indecision candles are listed in the chapter: “Types of candles”. Once the zone has been created, we will enter the retest of that zone, where the banks will place their orders.
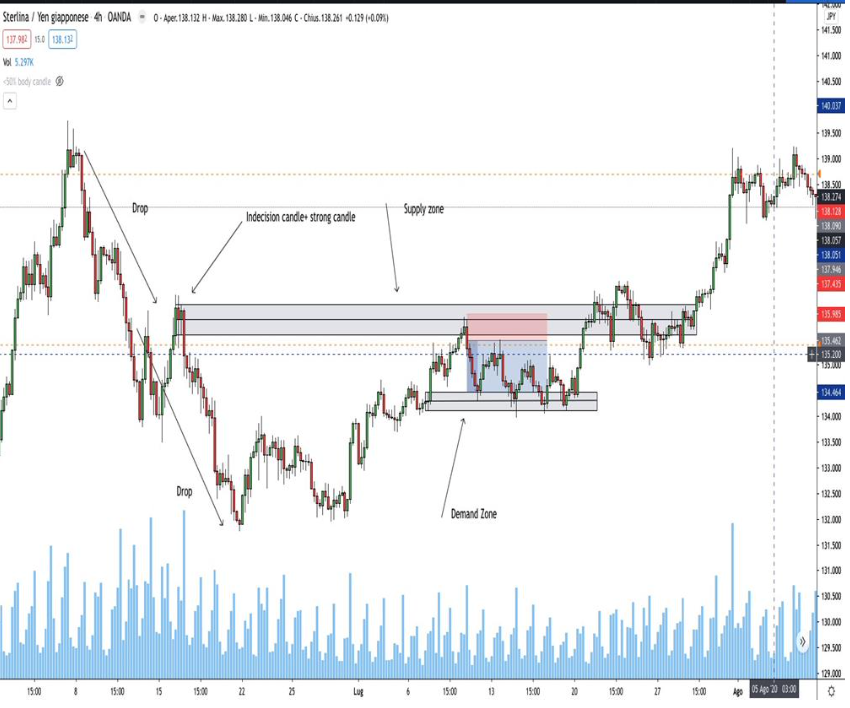
In the above case, we are in a DBD; as you can see, once the zone has been created, we wait for the retest, and we will place our orders there.
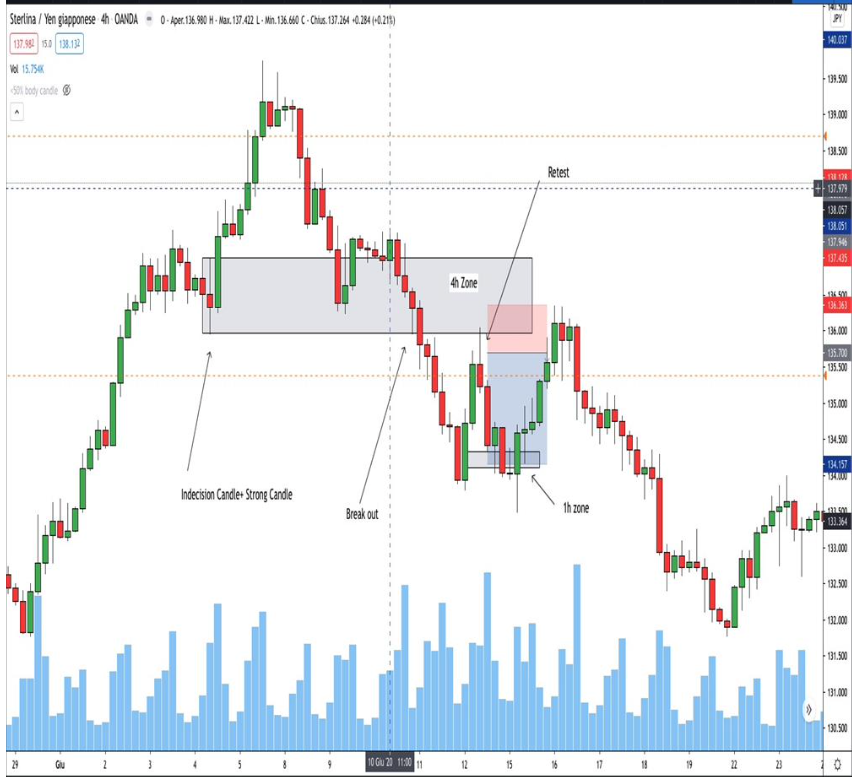
In this case, the Demand zone was broken and consequently transformed into a Supply zone. The reason I didn’t open a long position on the first touch is because I didn’t get a confirmation; I waited, the market broke the zone and then continued its descent trend. Trading is patience! There are demand and supply areas that are called Fresh.
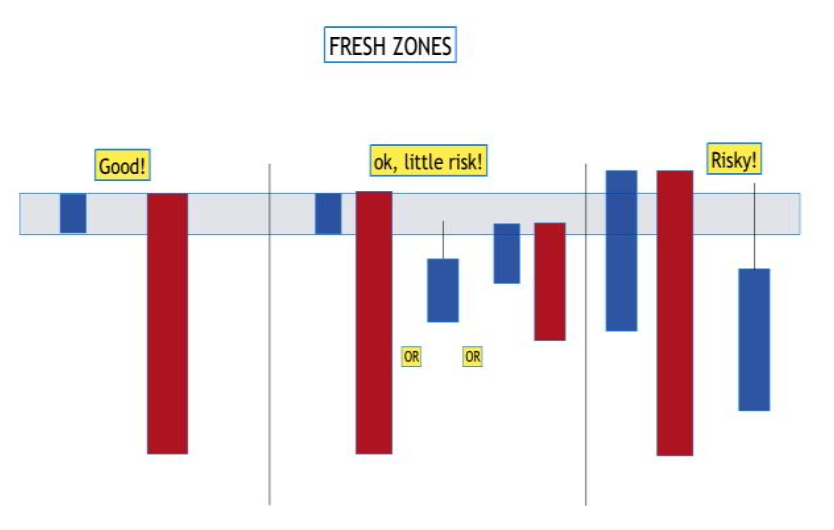
Fresh zones are defined as areas with a high probability of causing a change of direction. The less “traffic” there is within the area, the more effective the zone will be. If the zone is not fresh, it will be easily broken. The more touches there are in your Supply and Demand zone, the more likely the price will not stop. Always check before entering a trade, please! I always advise you to follow the trend; there is no reason to bet against the general market trend! You can understand the general direction from the higher time frames. I have attached two examples.
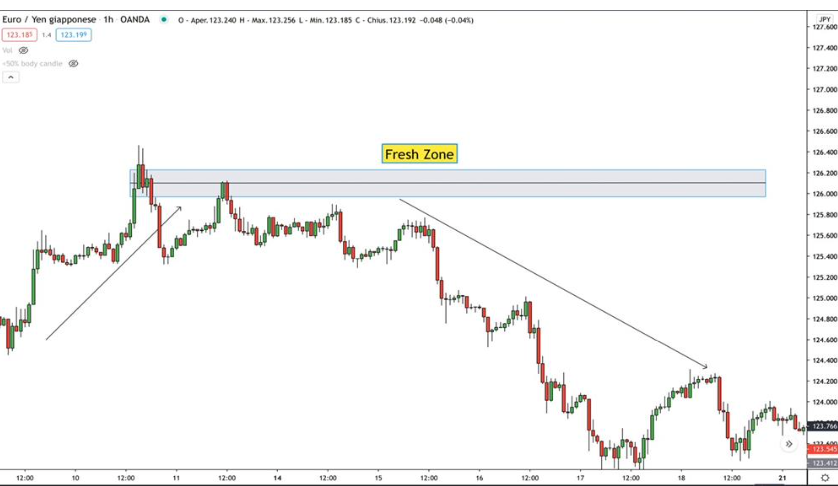
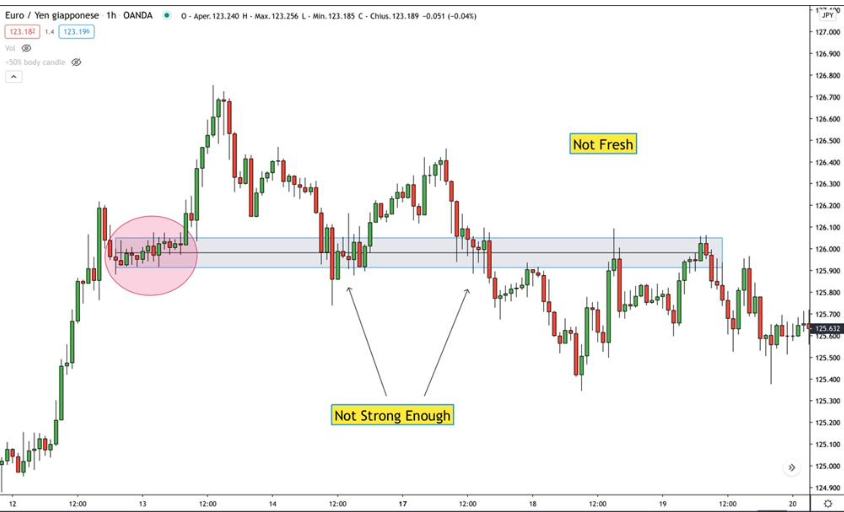
Important: The Demand or Supply zone is no longer valid after 3 touches.
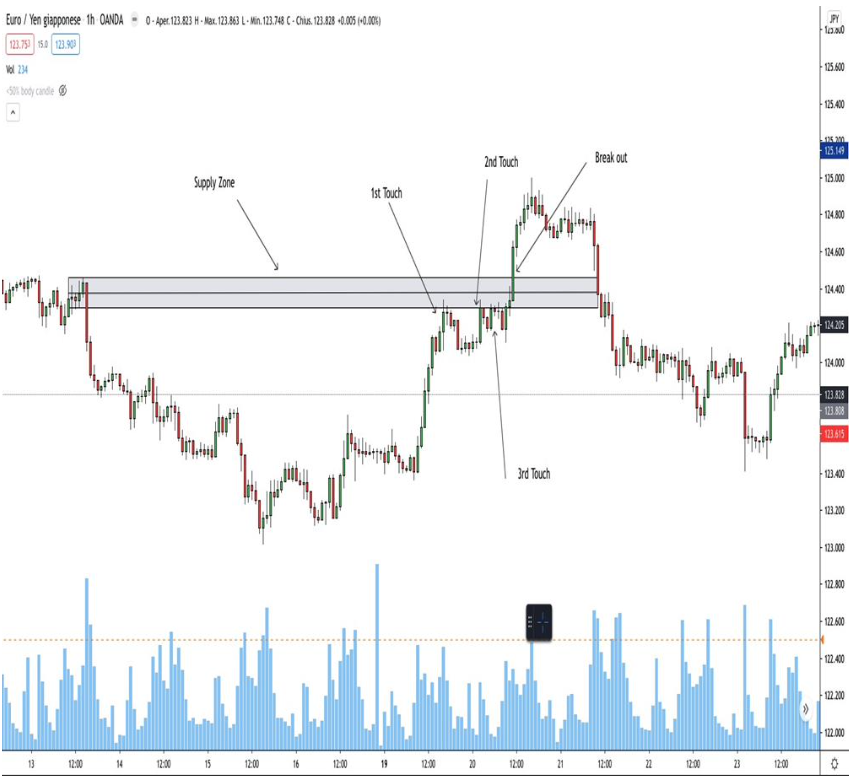
As you can see, there are blue volumes under my graphs, but what are they used for? The higher the volume, the more people are in the market. When the price reaches our Demand or Supply zone, and our volume is high, it is time to take advantage of it as the price will likely change direction. Similarly, if a Supply and Demand zone is created with a high volume, the zone will have more strength.
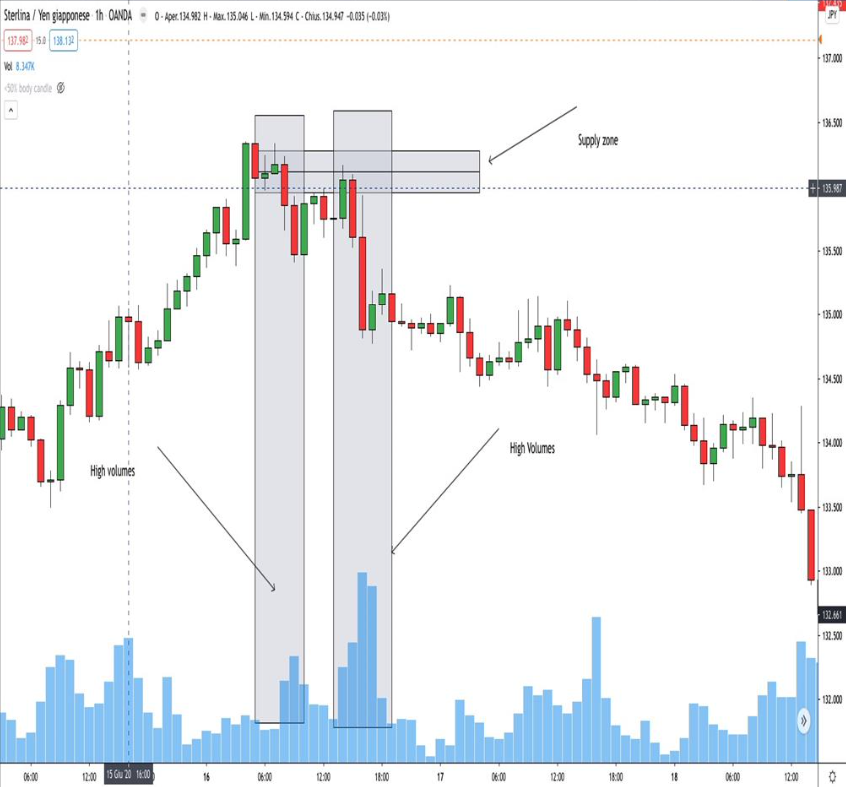
As you can see from the graph, the Supply zone was created with a high volume, which gave it strength. Once we reached the area, the price also had a high volume; that’s our entrance. Remember that the Demand and Supply zones can be used at any Time Frame. I recommend using it at 1h and 4h if you are a Scalper and at the Daily or Weekly if you are a Swing Trader. It’s time to open Trading View and practice!
“The secret to being successful from a trading perspective is to have an indefinite and tireless thirst for information and knowledge.”
Paul Tudor Jones
Share it:
Join the thousands of traders who have changed their lives Thanks to our instantly funded accounts
Don’t wait any longer, the perfect moment is NOW.