

Unlock the secrets of successful trading with our comprehensive FREE Trading Course designed for traders of all levels. Learn proven strategies, risk management techniques, and market analysis tools to elevate your trading game. Start today and gain the skills to trade confidently in any market!
Every day, we see stock market charts on the TV news. They are often “line” charts, but there are many other ways to read them. The most used are “lines”, “candles”, and “bars” charts. Let’s find them out!
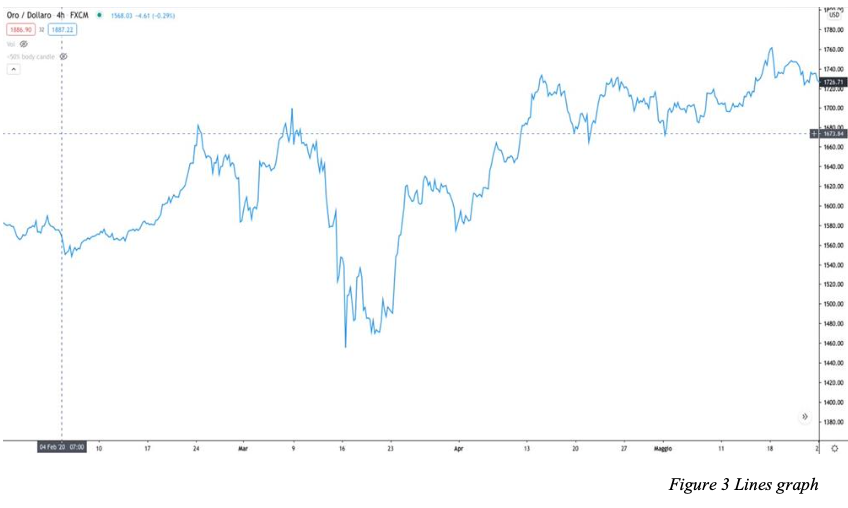
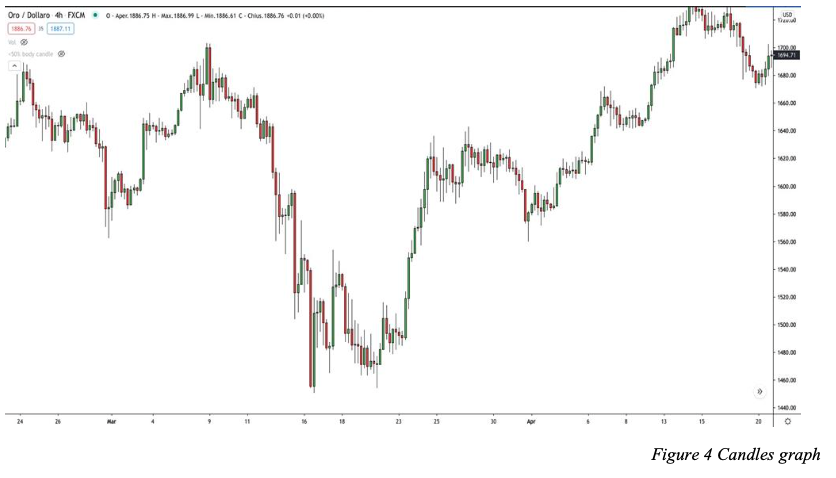
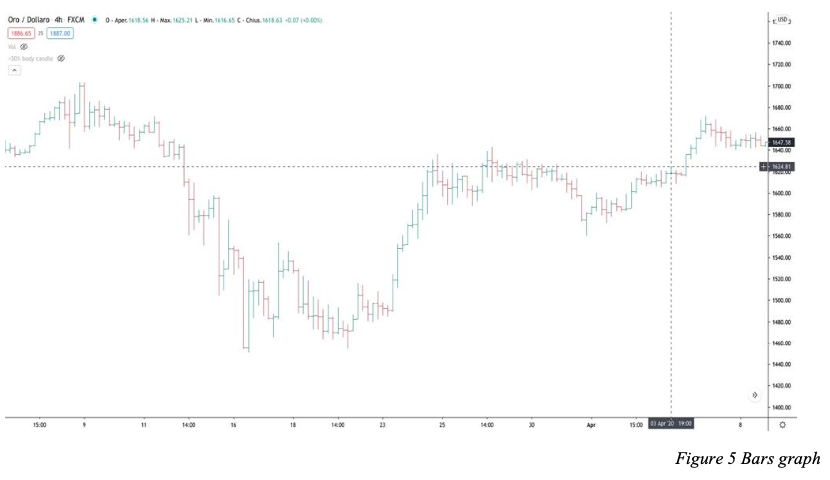
Guess what? The graph with which the market is analyzed is not the usual line chart they show us daily, but rather the candlestick one. It looks as complicated as a graph, but it’s not!
THE CANDLE GRAPH: As the name implies, the chart comprises many candles next to each other. Each candle indicates a respective time frame; if you set your chart at 1h, each candle will represent 1h of the day. If we set the chart at 4h, each candle will indicate 4h of the day.
Important! The candles have 2 different colours respectively: green indicates a rise, red indicates a drop.
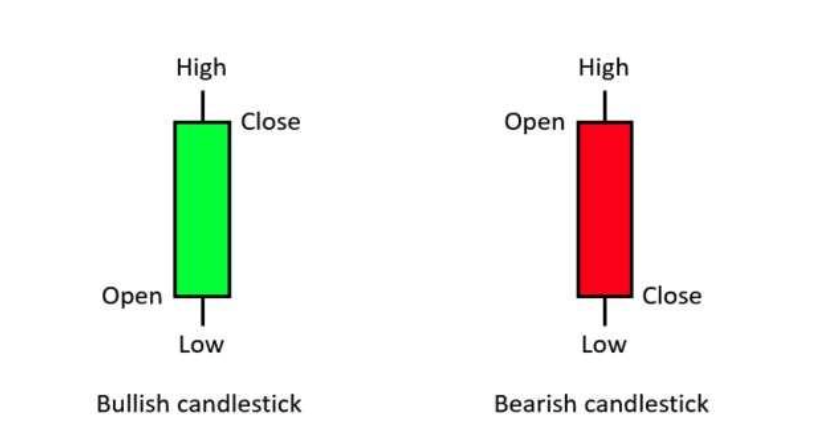
As you can see, each candle comprises a body and two shadows, the upper and the lower. If the market is uptrend (Bull Market), we will find many more green candles than red ones. Each green candle is formed by an opening level, which refers to the level at which the old candle closed and the beginning of the new one; the lower shadow indicates the lowest point where the price has arrived, and the upper shadow indicates the maximum price reached.
The body’s closing is the price achieved at the end of the minute. Remember that each candle indicates a specific period of time; therefore, the minimum and maximum points of a candle are referred to the time you set. In the event of a bearish trend (Bear Market), we will find many more red candles than green ones. The way of looking at them is the same, only the perspective changes. The closing point of the green candle will be the opening point of the red candle, while the opening point of the candle following our red candle indicates where our candle closed. The trend changes and, therefore, also the way of observing each candle.
Congratulations, now you know how to read candles, but unfortunately, this is only the beginning!
“The secret to being successful from a trading perspective is to have an indefinite and tireless thirst for information and knowledge.”
Paul Tudor Jones
Share it:
Join the thousands of traders who have changed their lives Thanks to our instantly funded accounts
Don’t wait any longer, the perfect moment is NOW.