

Unlock the secrets of successful trading with our comprehensive FREE Trading Course designed for traders of all levels. Learn proven strategies, risk management techniques, and market analysis tools to elevate your trading game. Start today and gain the skills to trade confidently in any market!
In trading, there are not only supports and resistances, but other patterns must be considered very important. Price often forms channels in which the trend bounces. You must recognize them to be prepared to enter the market. Those must be known perfectly, but don’t worry; you will begin to notice them even without drawing the graph.
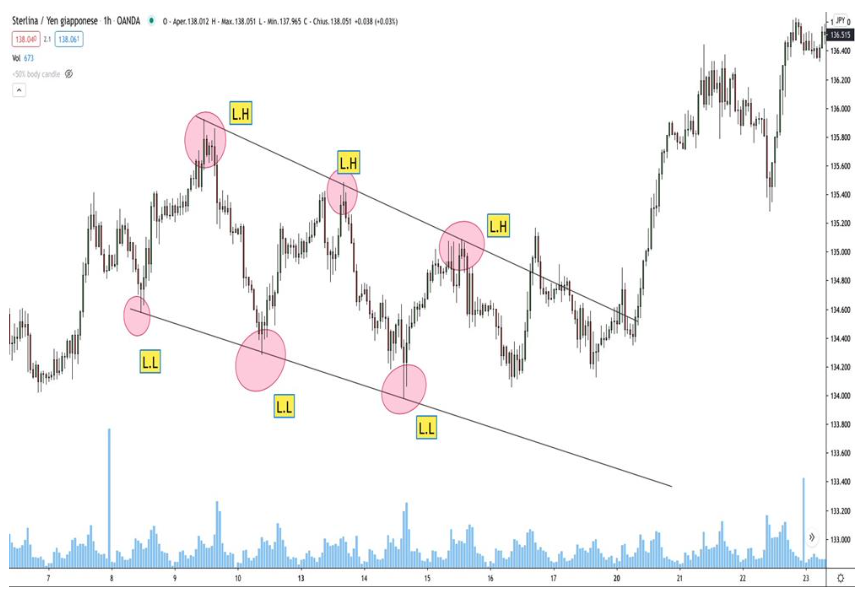
As you can see, the price has formed a descending channel in which many L.L. (Lower Low) and L.H. (Lower High) have been created. Of course, if the trend had been upward, H.H. (Higher High) and H.L. (Higher Low) would have been formed, but we’ll talk about this later. Let’s find out what the perfect entrance would have been.
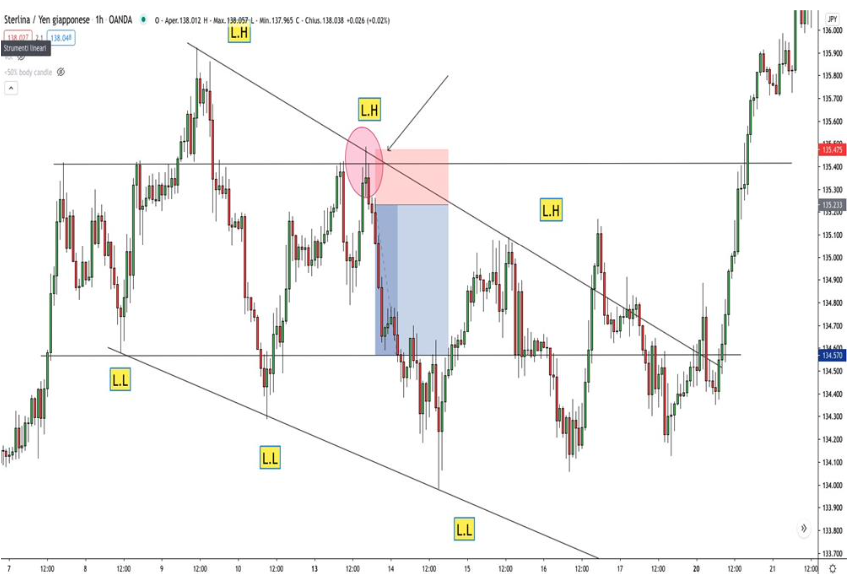
As you can see, I have drawn two lines of support and resistance. At the second L.H., my support has crossed the trend line; you will probably already think: “This is the time to sell”. No! Wait. I have highlighted the candle that has come to form. Do you recognize it? It indicates a change in trend; we are waiting for confirmation and are ready to send a Sell order. The S.L. we placed above the highest candle and our T.P. at the resistance level is hit.
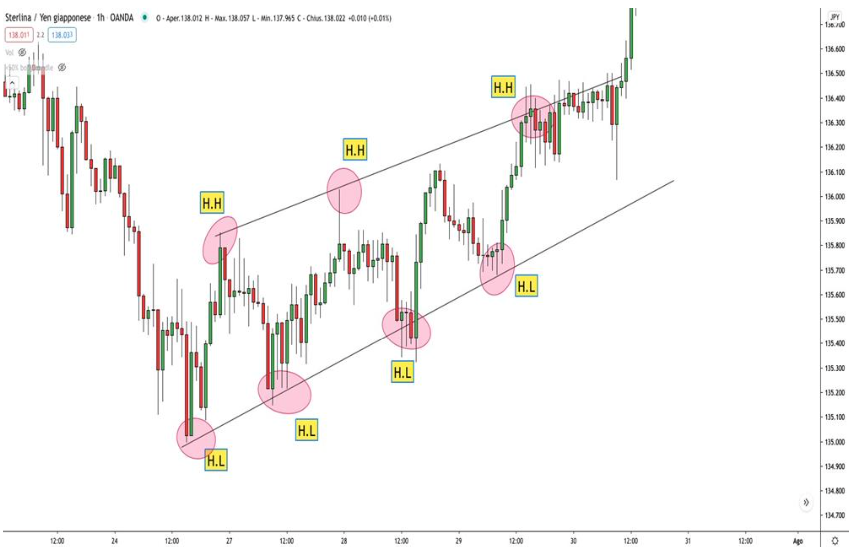
In this case, we are talking about an ascending trade; therefore, H.H. and H.L. were formed. The first thing to do was to create our trend lines, and then I entered with a Buy at the third H.L. after a DOJI candle with the crossing in a support point. Simple! There are many other patterns in trading, and now we will try to study them together.
HEAD AND SHOULDERS:As you can easily see, this pattern is formed by a “left shoulder”, “the head”, necessarily higher than the shoulders, and the “right shoulder”. I have highlighted the base of all three, called the “neck”. My advice is only to enter this pattern when the neck is broken.
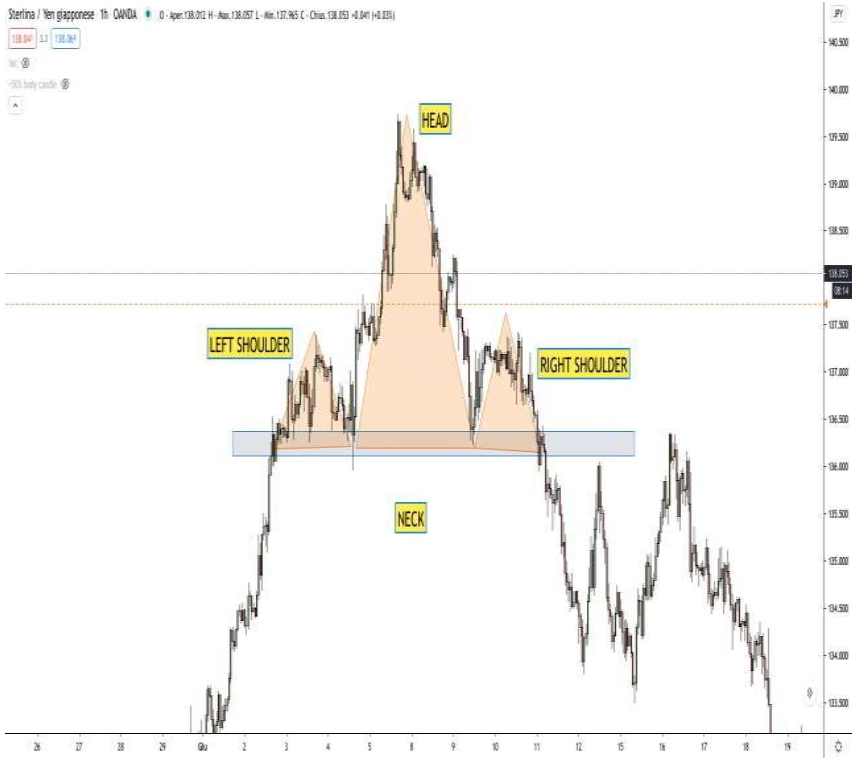
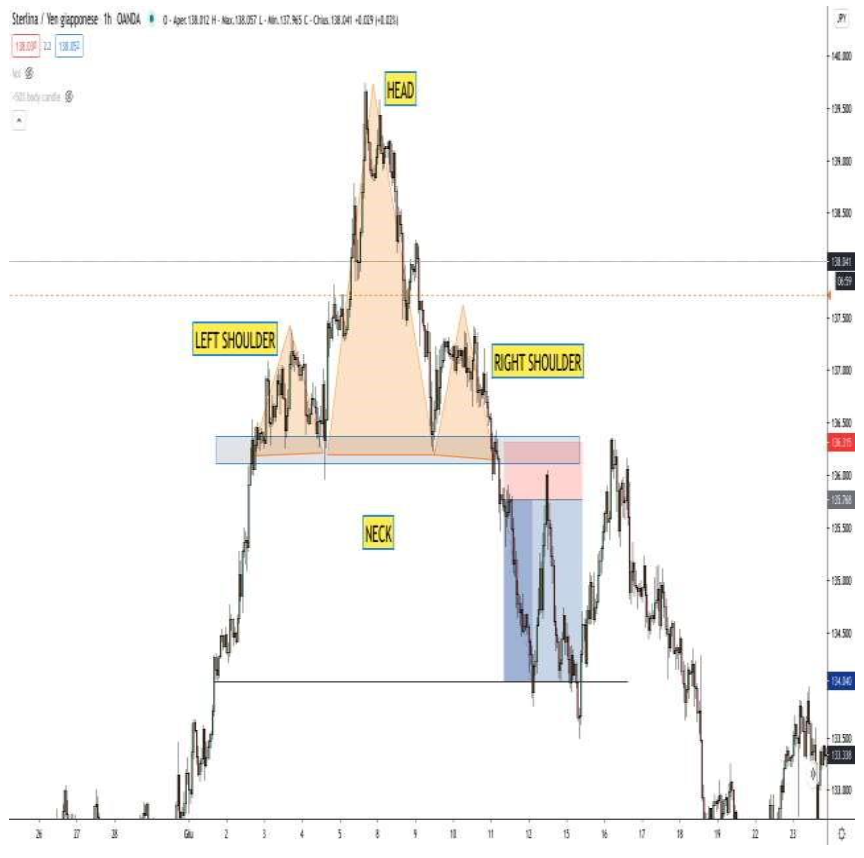
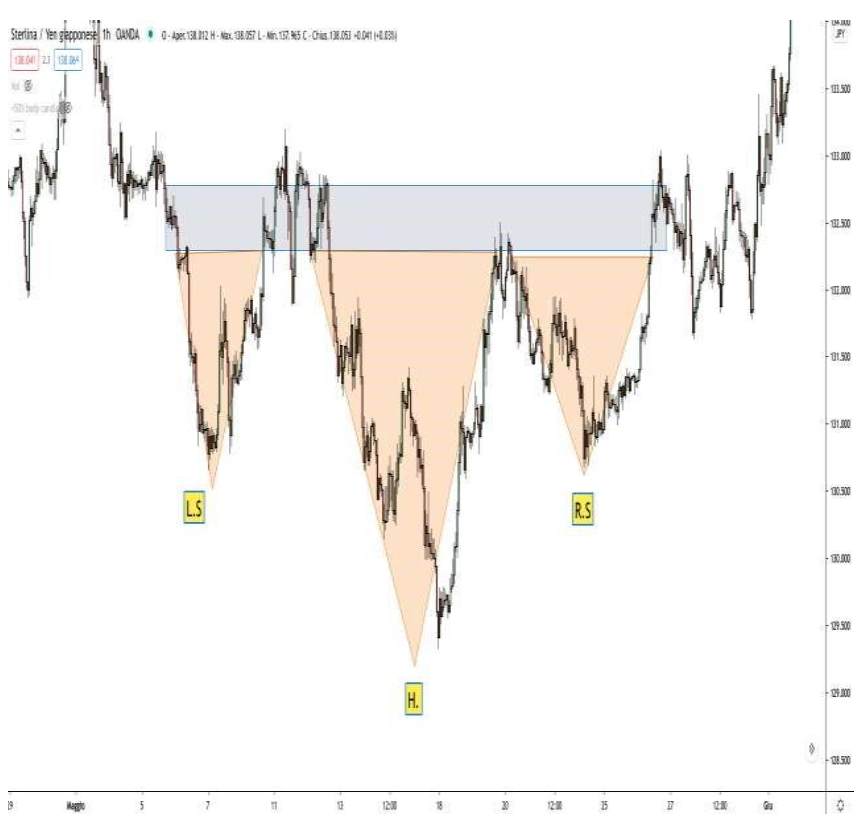
As you can see, the neck break was followed by a retest (a new touch) on the base of the neck, after which it continued its descent. The retest happens after every pattern break; it can be a Head and Shoulders or any other. The S.L. placed its 10-15 Pips above the breakout zone, we waited for confirmation, and we entered the market with a Sell. The Head and Shoulders Pattern can also be found inversely. In case of non-breaking of the neck, I do not recommend an entrance.
HORIZONTAL CHANNEL: As you can see from the graph, it is elementary to make profits. The price is in a horizontal channel and will bounce every time for that precise range. In this case, the areas of S.L. and T.P. are very simple to find; resistance and support are our wild cards.
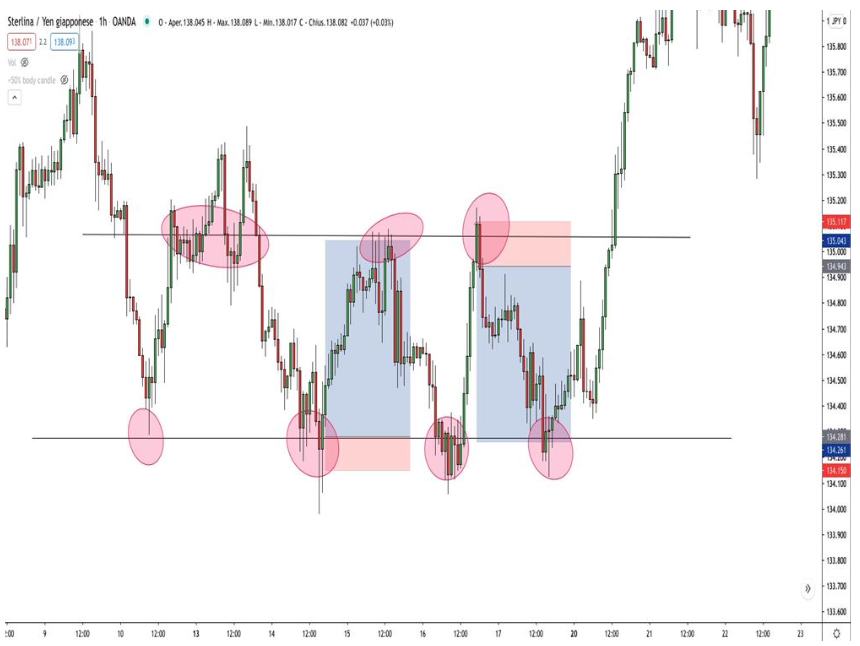
DOUBLE TOP: This type of pattern is very easy to spot, but it is essential to know in the trading world. As you can see from the word, the pattern is formed by a double top on the resistance level and by a ” neckline ” support.
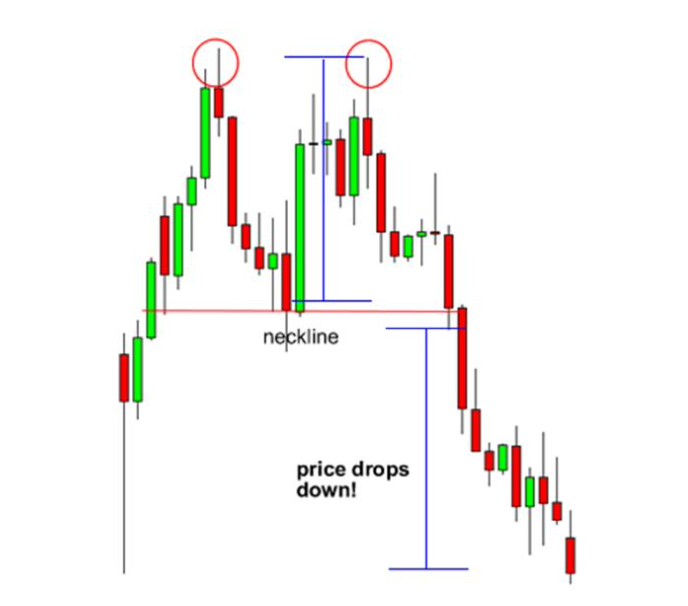
In this pattern, you can enter the trade in 2 scenarios:
DOUBLE BOTTOM: This pattern is the same as the one we studied previously, only in reverse. In this case, we will open a long position, not a short one.
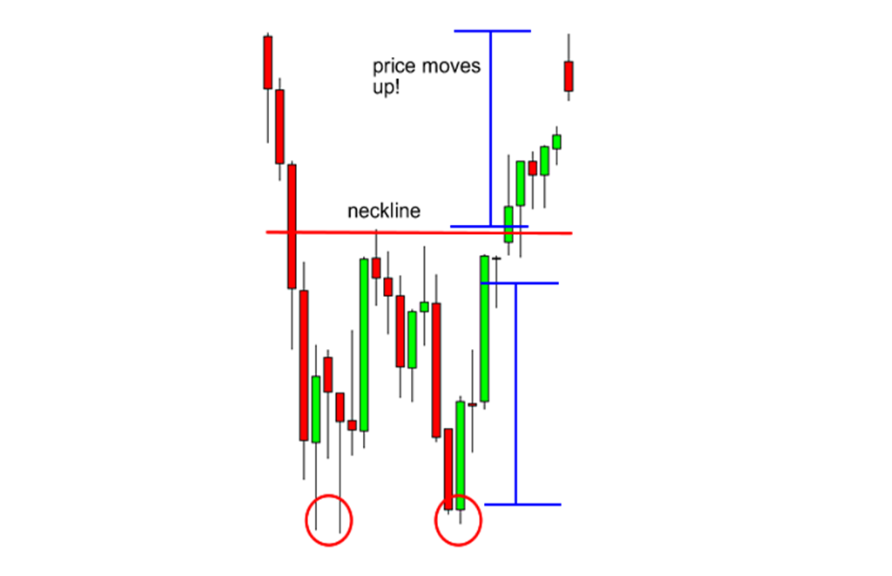
Also, in this case, the perfect entry is either after the neck break or at the second touch if the candle indicates indecision.
TREND BREAKOUT: In this case, we are not studying an actual pattern but a continuous movement that the market makes. As we have already learned, the market follows trend lines, but often, these can be broken after a certain time, and consequently, a new trend will be formed. The breaking of the movement can allow us a safer entry into the market; remember that the higher the time frame, the more correct your analysis will be. 90% of broken trend lines are followed by a retest as if it were a “double top/bottom”. Once the retest has been carried out with a candle of indecision inside, it is time to enter. If the retest is not present, I do not recommend an entrance. Obviously, the breaking of the trend can happen in any pattern, but the important thing is to wait for a retest; remember that trading is 90% patience.
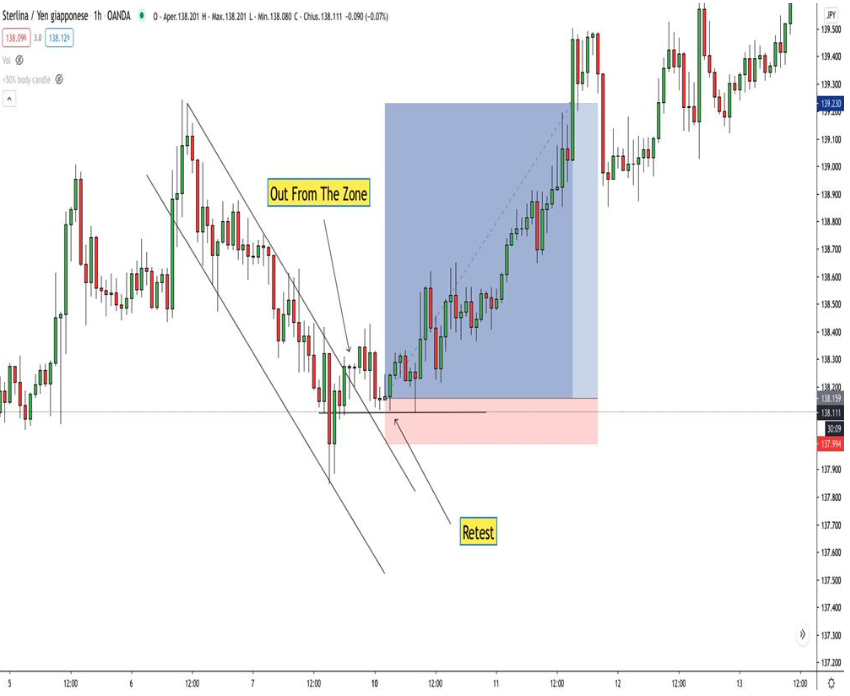
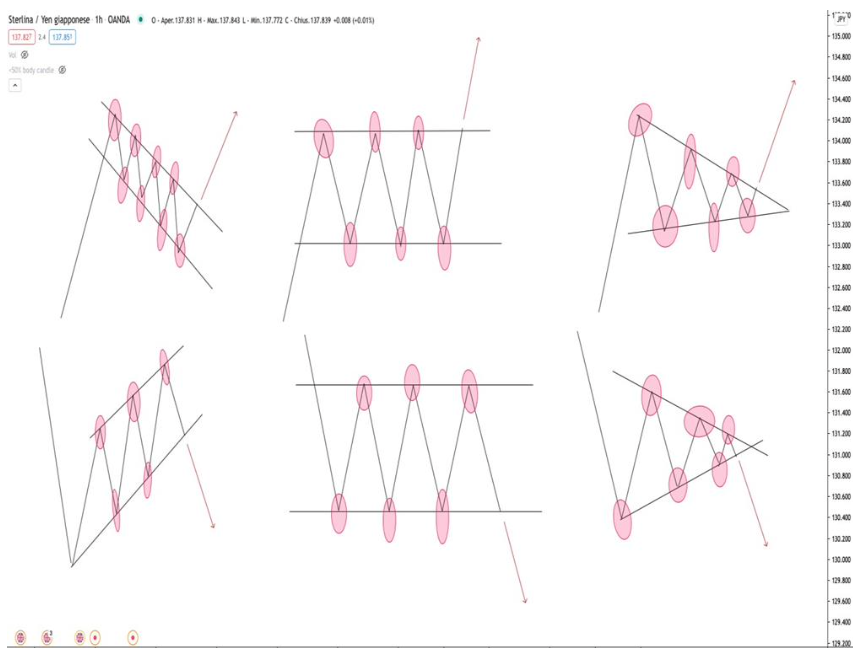
In the image above, I have drawn some possible patterns. Before continuing to study, I recommend you to open Trading View and start practising what you have learned so far!
“The secret to being successful from a trading perspective is to have an indefinite and tireless thirst for information and knowledge.”
Paul Tudor Jones
Share it:
Join the thousands of traders who have changed their lives Thanks to our instantly funded accounts
Don’t wait any longer, the perfect moment is NOW.