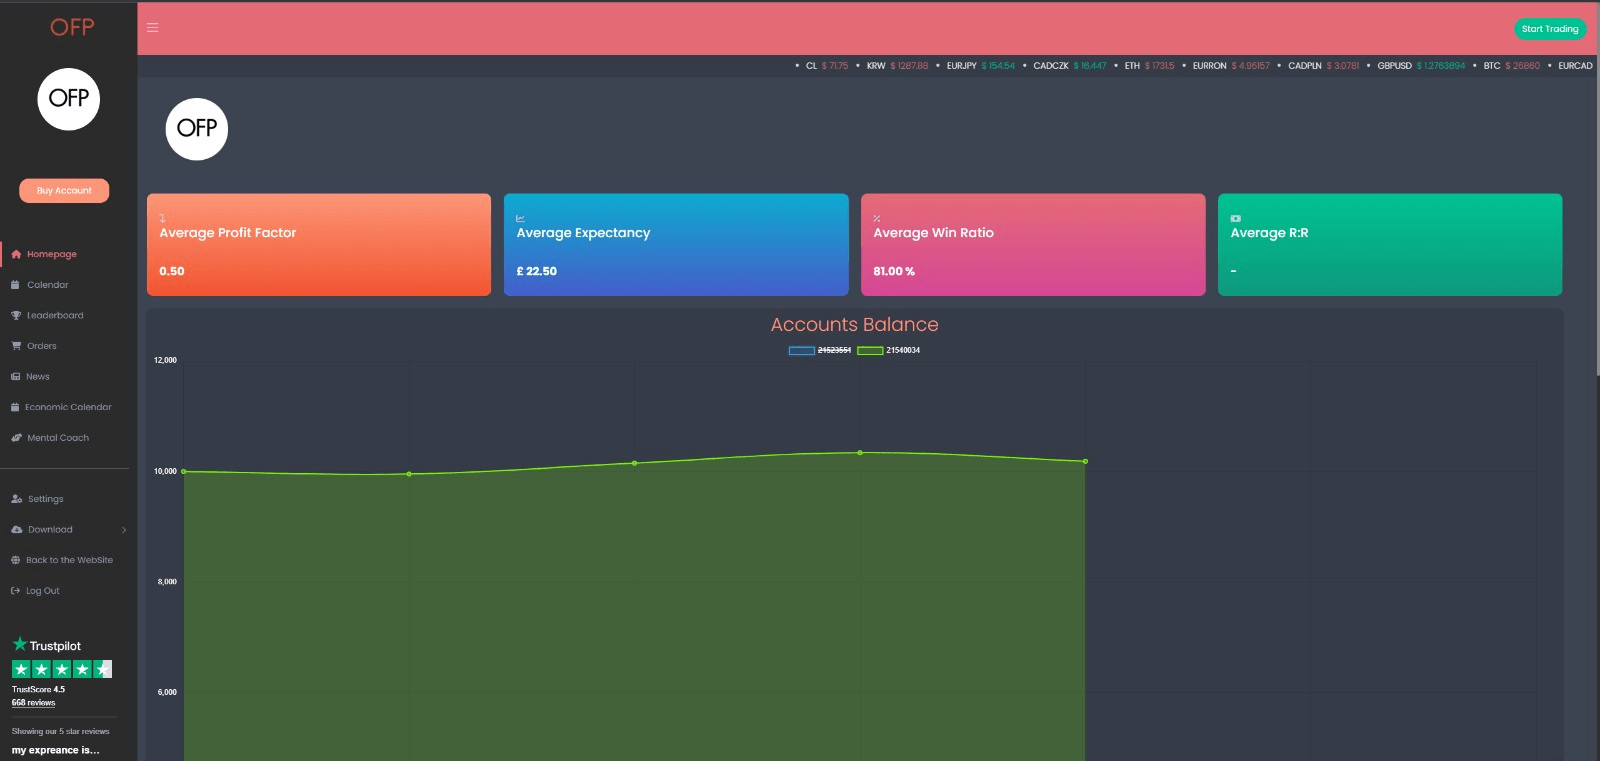
In the fast-paced world of trading, having access to comprehensive and real-time data is crucial for making informed decisions. OFP Funding, a premier proprietary trading firm, understands the importance of providing traders with cutting-edge tools. With the launch of their new trading dashboard, OFP is revolutionizing the way traders interact with the markets. Let’s delve into the five powerful features that make this dashboard a game-changer.
-
In-Depth Statistics About Your OFP Trading Accounts
Transparency and clarity are paramount when it comes to managing trading accounts. OFP’s new trading dashboard delivers in-depth statistics that offer a comprehensive overview of your account’s performance. From overall profit and loss to individual trade breakdowns, you’ll have a clear understanding of your trading activities. Analyzing your trading history allows you to identify patterns, learn from past mistakes, and refine your strategies for future success.
-
2-Minute Equity Graph
Time is of the essence in trading, and being able to quickly grasp the equity movement of your account is a must. The 2-minute equity graph featured on OFP’s dashboard provides an instant visualization of your account’s equity changes. This graph allows you to spot trends, assess the impact of specific trades, and make timely adjustments to your positions.
-
Cumulative Statistics
To gauge your progress as a trader, it’s crucial to track your cumulative performance over time. OFP’s dashboard offers cumulative statistics that showcase your overall trading journey. By seeing how your profits accumulate and evolve, you can measure your growth and identify periods of exceptional performance or drawdowns. Armed with this knowledge, you can fine-tune your trading strategies for consistent profitability.
-
Profit Calendar
Keeping track of your trading profits is essential, but understanding the factors that influence them is equally important. OFP’s Profit Calendar is a unique tool that allows you to correlate your profits with specific events, announcements, or market movements. This feature helps you identify patterns of profitability and understand which market conditions favor your trading style. Armed with this knowledge, you can adapt your approach to capitalize on favorable conditions.
-
Economic Calendar with Relevant Events
Trading decisions often hinge on economic events and their potential impact on the markets. OFP’s dashboard includes an Economic Calendar that highlights upcoming relevant events and announcements. Whether it’s central bank meetings, economic data releases, or geopolitical developments, being aware of these events empowers you to make more informed trading decisions. The dashboard ensures you never miss a critical event that could sway the markets.
In conclusion, OFP’s dashboard is a powerful tool that puts invaluable information at your fingertips. With in-depth statistics about your trading accounts, a 2-minute equity graph, cumulative statistics, a profit calendar, and an economic calendar, traders can enhance their decision-making process, refine their strategies, and achieve greater success in the dynamic world of trading. So, gear up and embrace the power of OFP’s trading dashboard to elevate your trading experience to new heights.
For a full walkthrough of all OFP’s dashboard has to offer, check out our Youtube video.


