


Unlock the secrets of successful trading with our comprehensive FREE Trading Course designed for traders of all levels. Learn proven strategies, risk management techniques, and market analysis tools to elevate your trading game. Start today and gain the skills to trade confidently in any market!

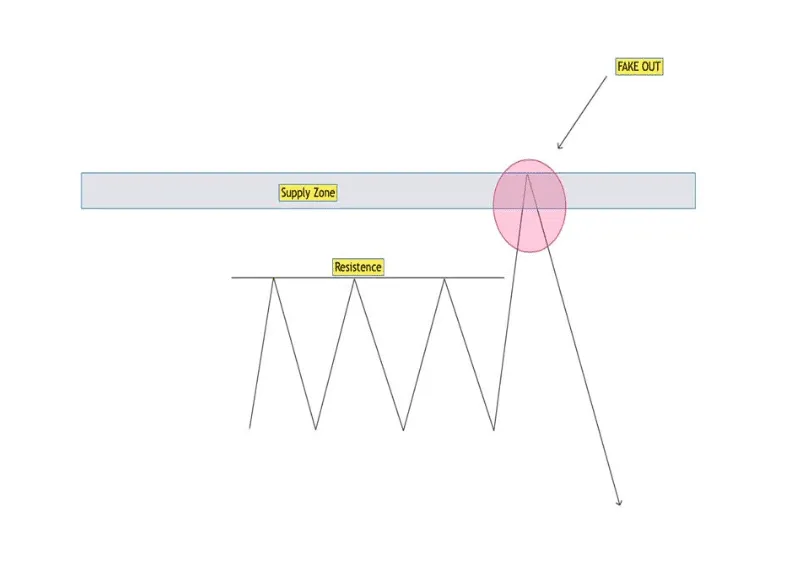
Many of you have already heard of the Fake Out; the Fake Out can be considered a market manipulation that serves to deceive traders. It happens after a long series of ascending or descending markets; the price breaks the support or resistance, and traders believe the price will continue, but it will not! The price will retrace, and their own S.L has knocked out all those who thought it would continue its trend. The Fake Out can occur in any time frame, both in Supply and Demand areas and areas of resistance and support.
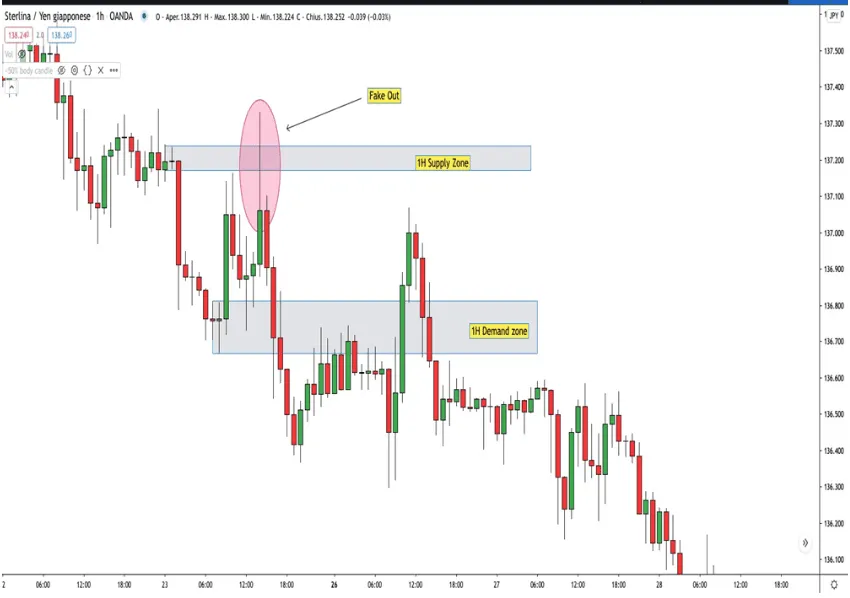
As you can see from the image above, the price has reached the Supply Zone twice in its descent. The first touch bounced the price that immediately reached the Demand Zone; the second touch created a Fake Out. 90% of traders, once they saw the break of the zone, went long. The price retraced, and their S.L. was taken. Do you understand why 90 +% of traders are not profitable? How do we recognize a Fake Out? Now I’ll explain it to you.
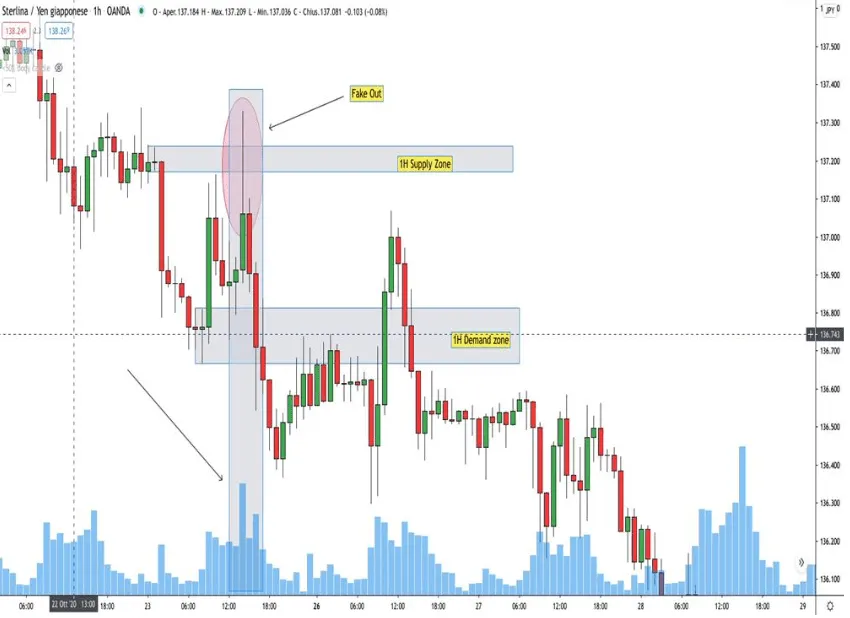
Do you remember the volume? Now, it is necessary. As we have already studied before, if the price reaches the Demand or Supply zone with a high volume, the price will probably retrace. And here is the explanation of the graph above!
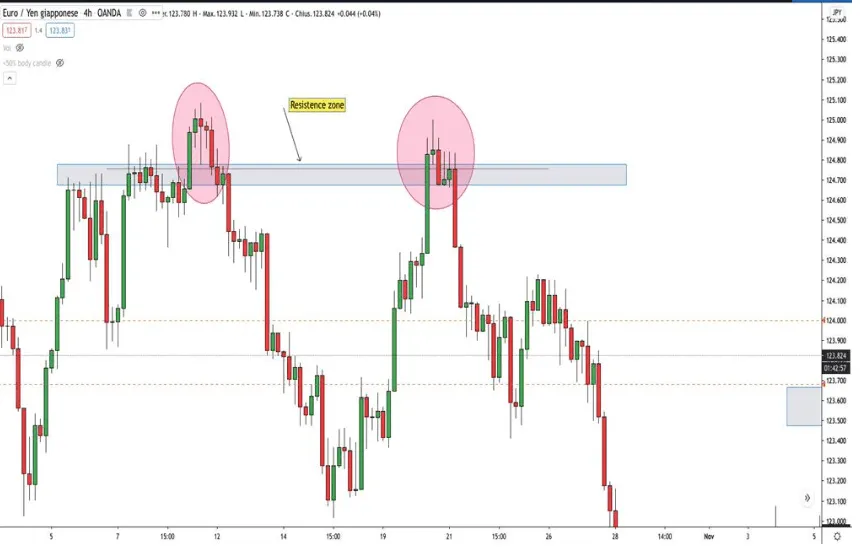
As I have already mentioned, fake-outs also occur in areas of support or resistance. Above, I have given you an example. I recommend you avoid falling into these simple pitfalls! Another type of manipulation is the compression zone. Let’s study it! First, we must say that the compression zone is the first signal the market “gives us” to make us understand that the price will reach the Demand or Supply zone.
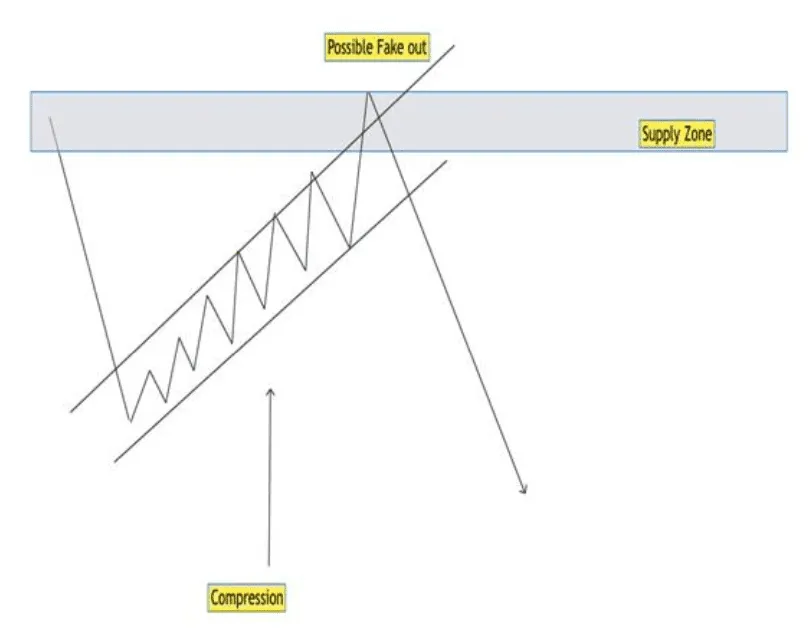
I have created a possible compression scenario for you in the image above. As you can see, the price was descending, retraced to the Supply Zone, and then continued its descent trend.
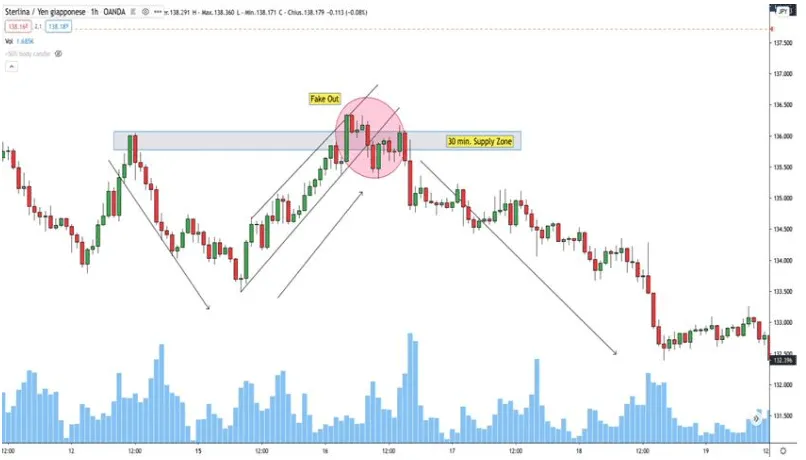
Here, there is an example of compression. In this case, the trend is descending while the compression is ascending. Of course, you can easily find the pattern in reverse. As you can see, a Fake Out is happening; how to recognize it? Take a look at the volume! Now you have all the technical knowledge to become part of the 5/10% of successful traders. Now it’s up to you!
BIG DREAMS HAVE SMALL BEGINNINGS
“The secret to being successful from a trading perspective is to have an indefinite and tireless thirst for information and knowledge.”
Paul Tudor Jones
Share it:
Join the thousands of traders who have changed their lives Thanks to our instantly funded accounts
Don’t wait any longer, the perfect moment is NOW.